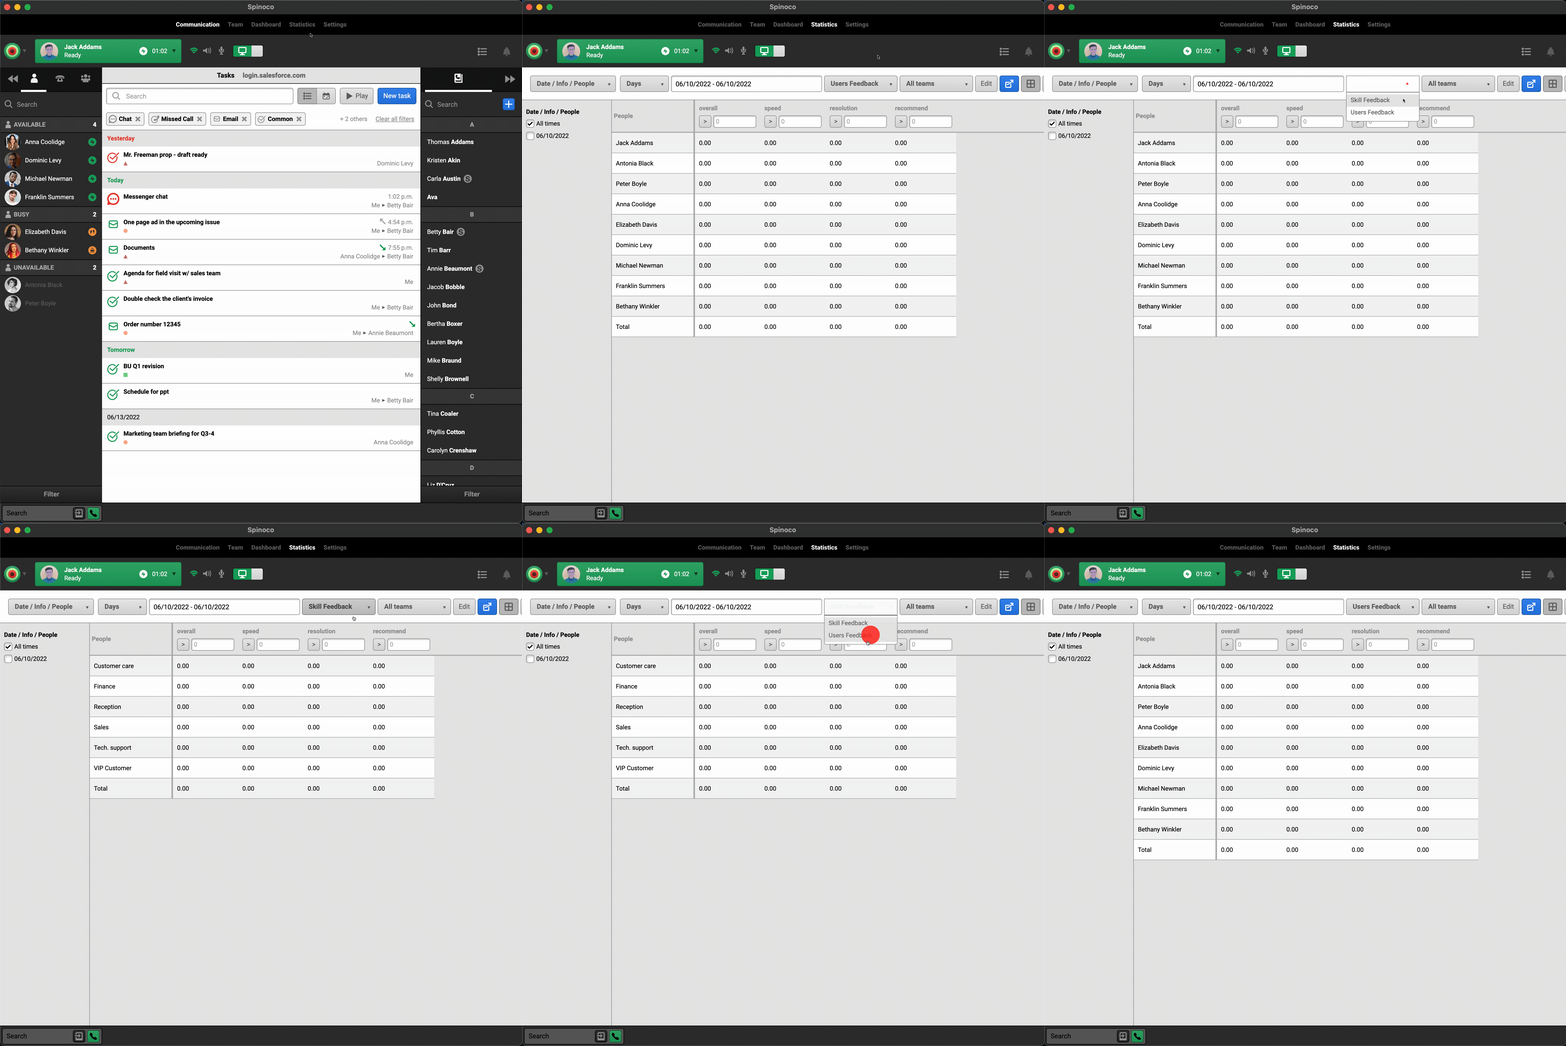
Před vlastní analýzou dat zpětné vazby ve Spinoco budete muset vytvořit reporty pro zpětnou vazbu. Jejich tvorba je naštěstí jednoduchá. Podívejme se, jak na to.
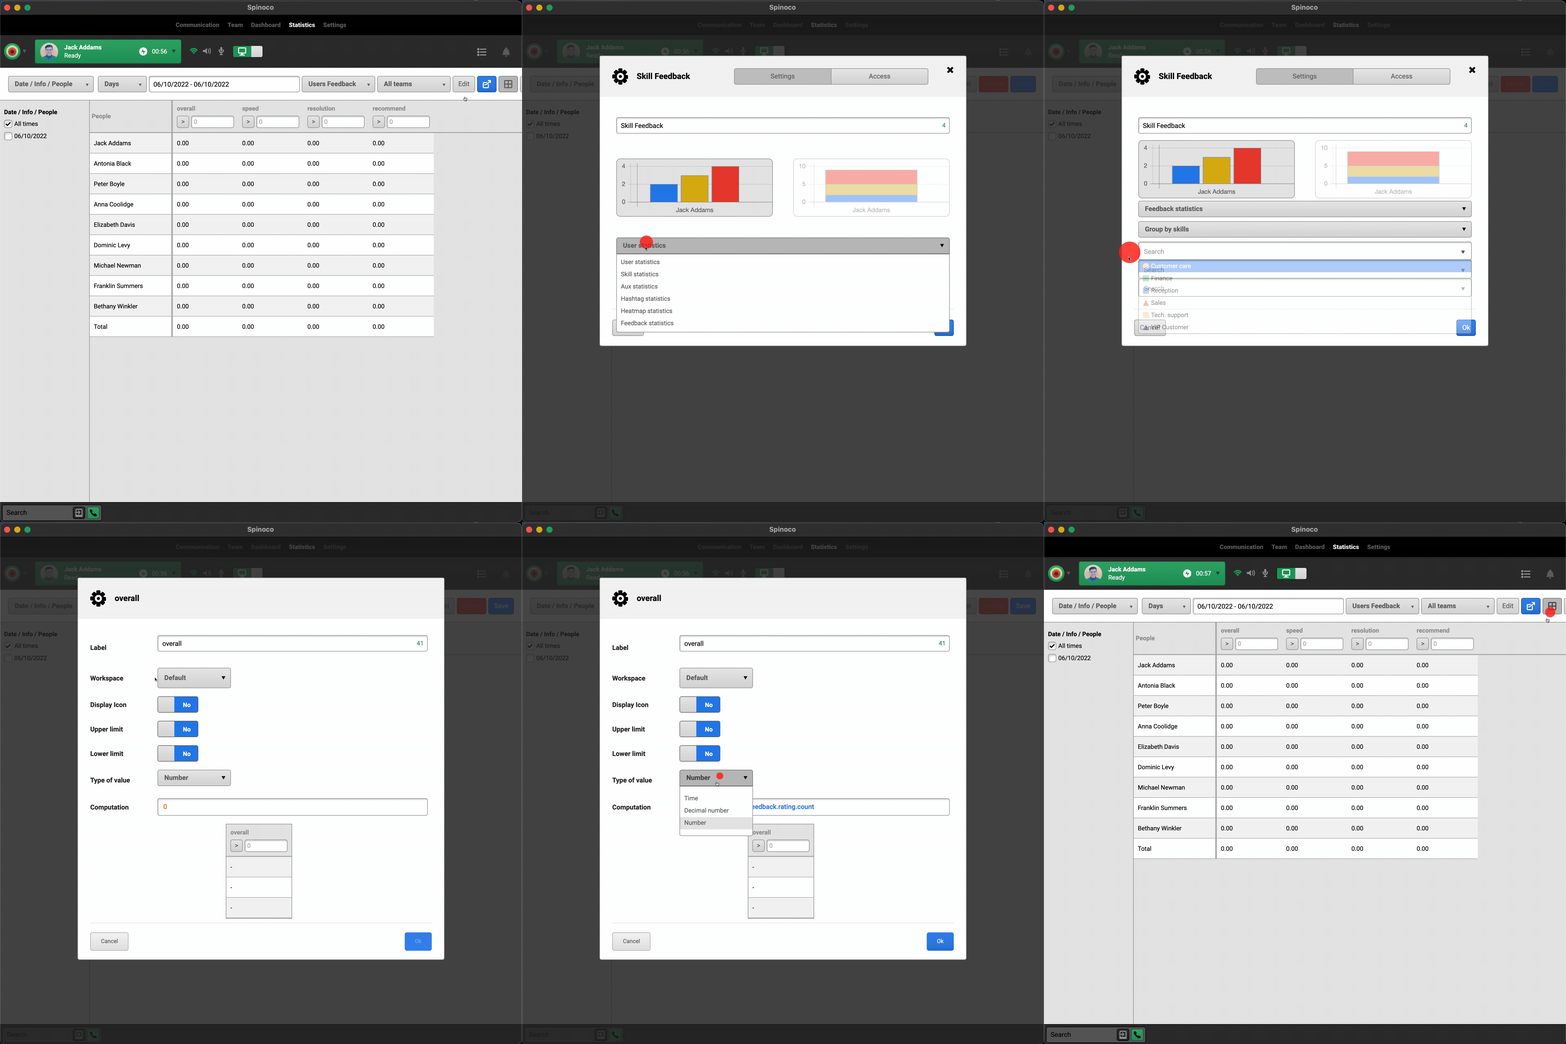
Přejděte na kartu Statistiky, klikněte na tlačítko Upravit vpravo nahoře a poté na velké modré tlačítko "+" pro vytvoření nového reportu. Zobrazí se vám jednoduché dialogové okno.
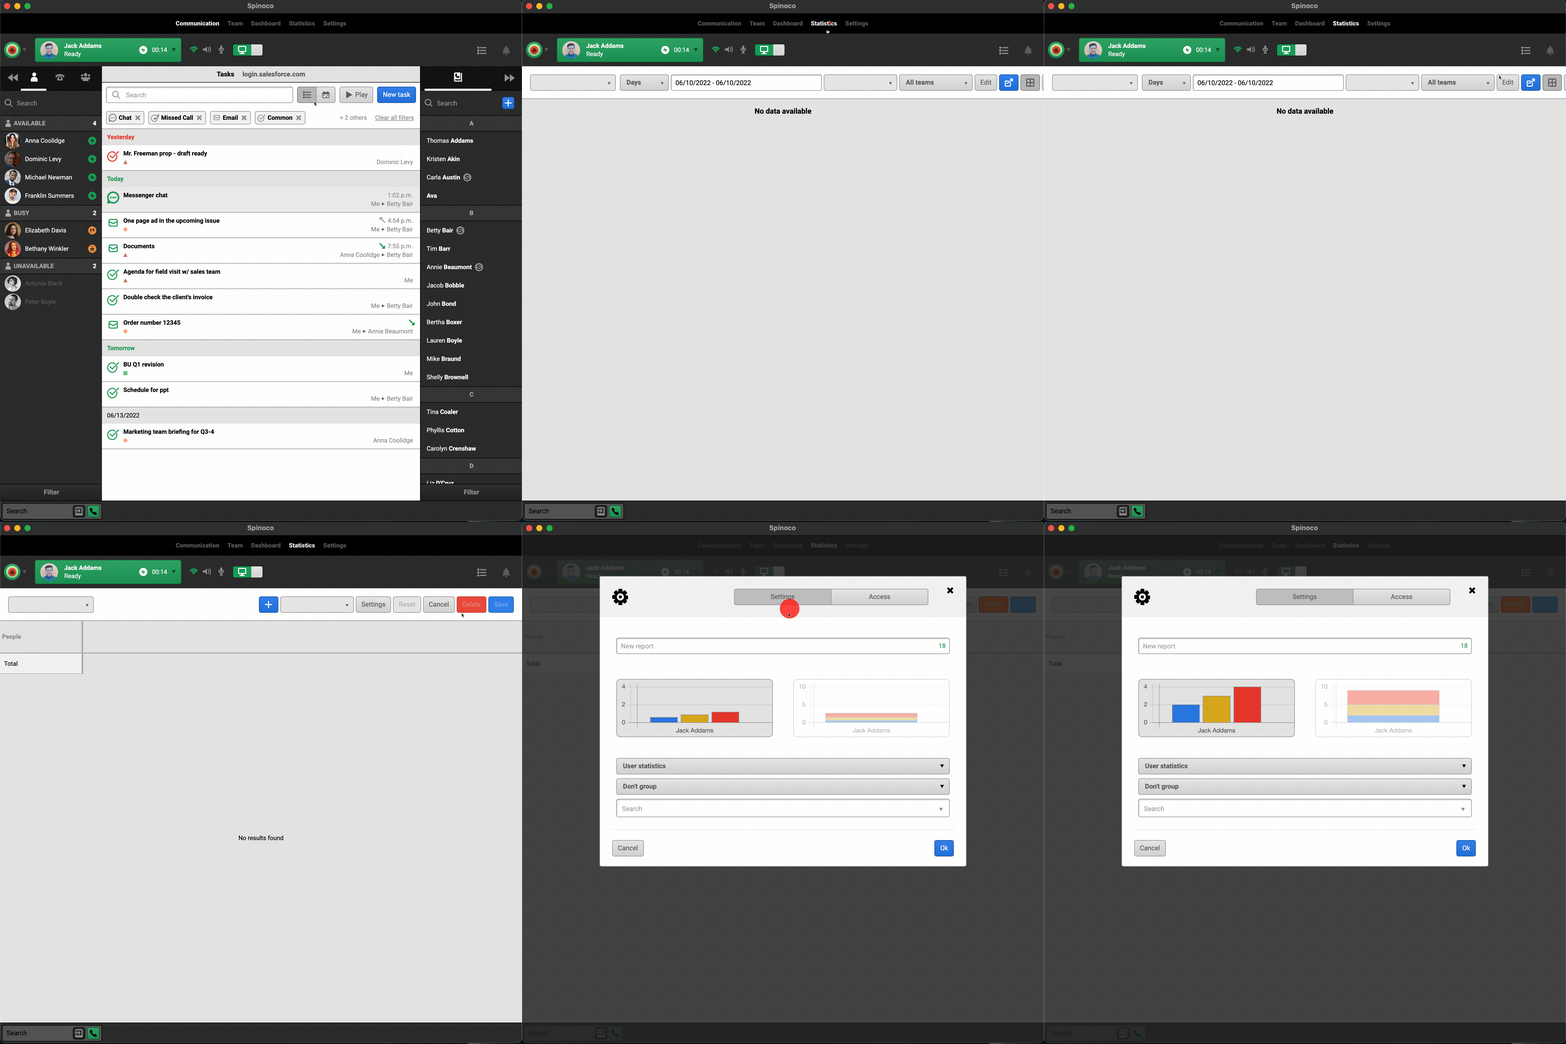
V dialogu nejprve zadejte název reportu. V tomto případě vytvoříme přehled se zpětnou vazbou podle uživatele, takže tuto sestavu nazvěme třeba Zpětná vazba uživatelů. V rozbalovacím menu druhů přehledů zvolíme možnost Statistika zpětné vazby. Druhá rozbalovací nabídka nabízí možnost data seskupit podle uživatelů nebo zručností. Pokud chcete, aby report ukazoval zpětnou vazbu podle front, vyberte Seskupit dle zručností; jinak ponechte Seskupit dle uživatelů.
Následující rozbalovací menu umožňuje dále specifikovat, kteří uživatelé mají být součástí reportu. Pokud chcete, aby byli v přehledu všichni uživatelé, ponechte ho prázdné, jinak vyberte uživatele, které chcete v přehledu zobrazit. Další rozbalovací nabídka umožňuje omezit statistiky na konkrétní workspace. Pokud chcete kompletní data, opět ponechte okno prázdné.
V posledním rozbalovacím menu je důležité vybrat ten formulář, pro který chcete zpětnou vazbu zobrazit. Bez této volby nebude možné report vytvořit. V našem případě jsme zvolili Demo formulář.
Jakmile jste spokojeni s nastavením, vytvořte report kliknutím na modré tlačítko Ok.
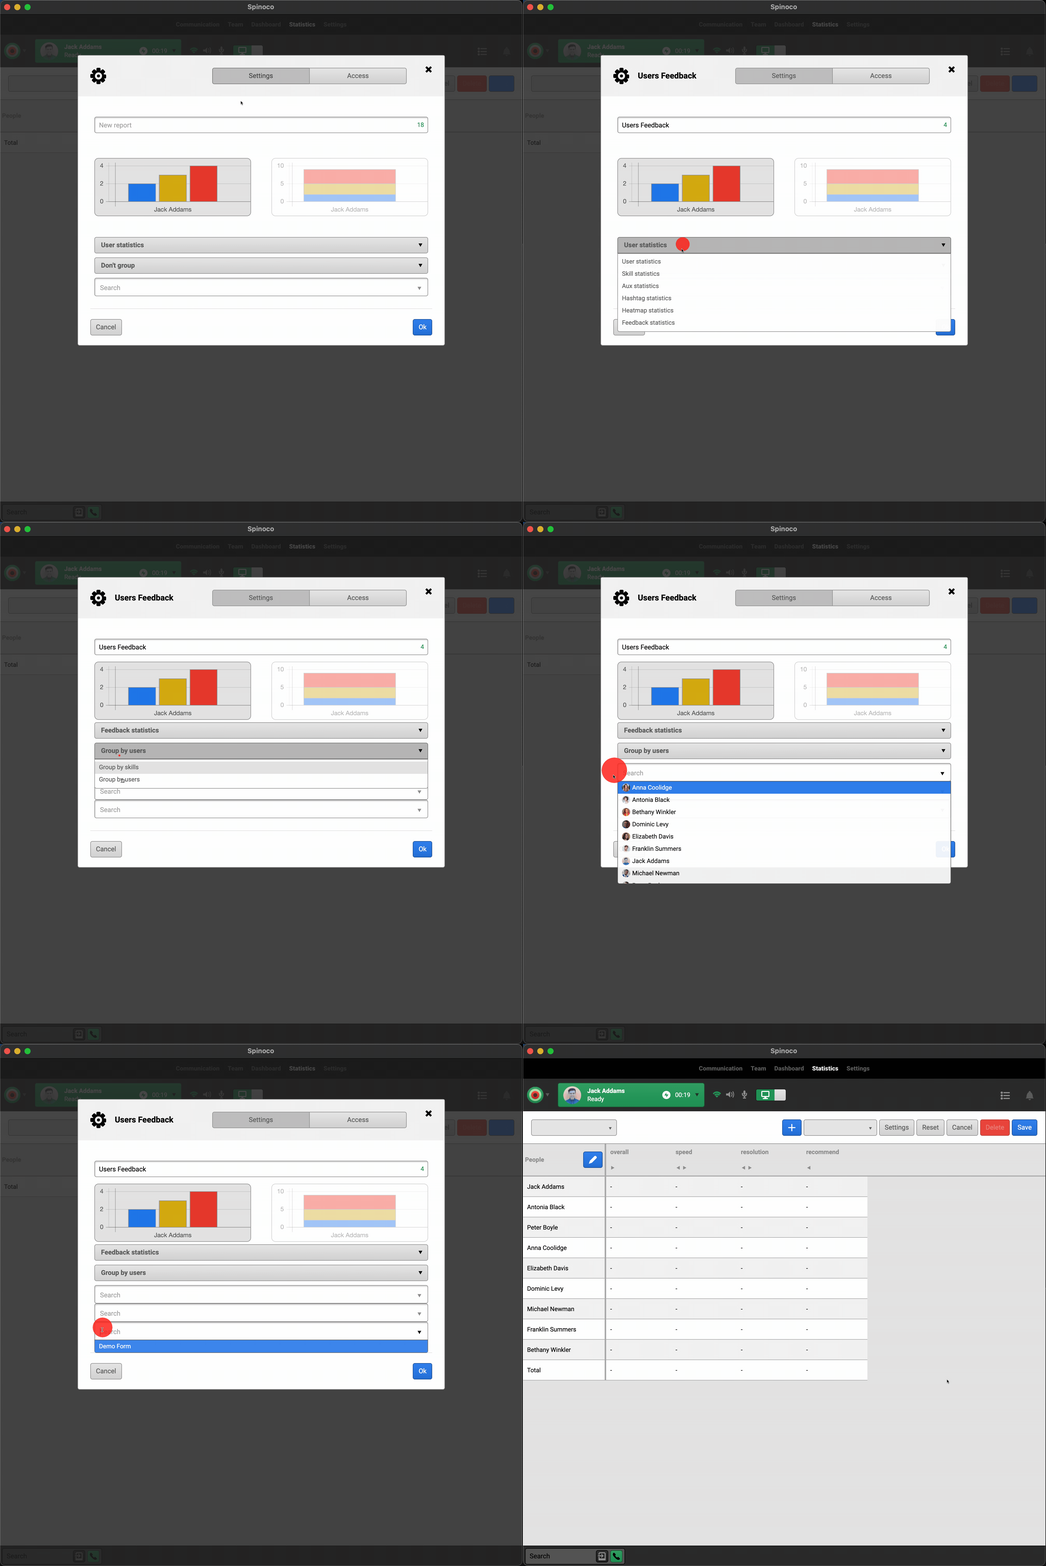
Už máte skoro hotovo; nyní už zbývá jen přiřadit statistický zdroj k datům, aby report věděl, jaká data má zobrazovat. Zdroj statistik snadno upravíte kliknutím na tlačítko s modrou tužkou. Pro tento přehled chceme zobrazit průměrné hodnocení v rámci zpětné vazby uživatelů. V poli Typ hodnoty upřesníme, že chceme, aby se data zobrazovala jako desetinné číslo se 2 desetinnými místy. Výpočet by měl být součtem všech získaných zpětných vazeb dělený počtem obdržených zpětných vazeb. Tedy "feedback.rating.sum / feedback.rating.count". V dialogovém okně klikněte na Ok, poté přehled uložte zmáčknutím tlačítka Uložit vpravo nahoře. Report je nyní připraven a zobrazuje průměrné skóre zpětné vazby uživatelů.
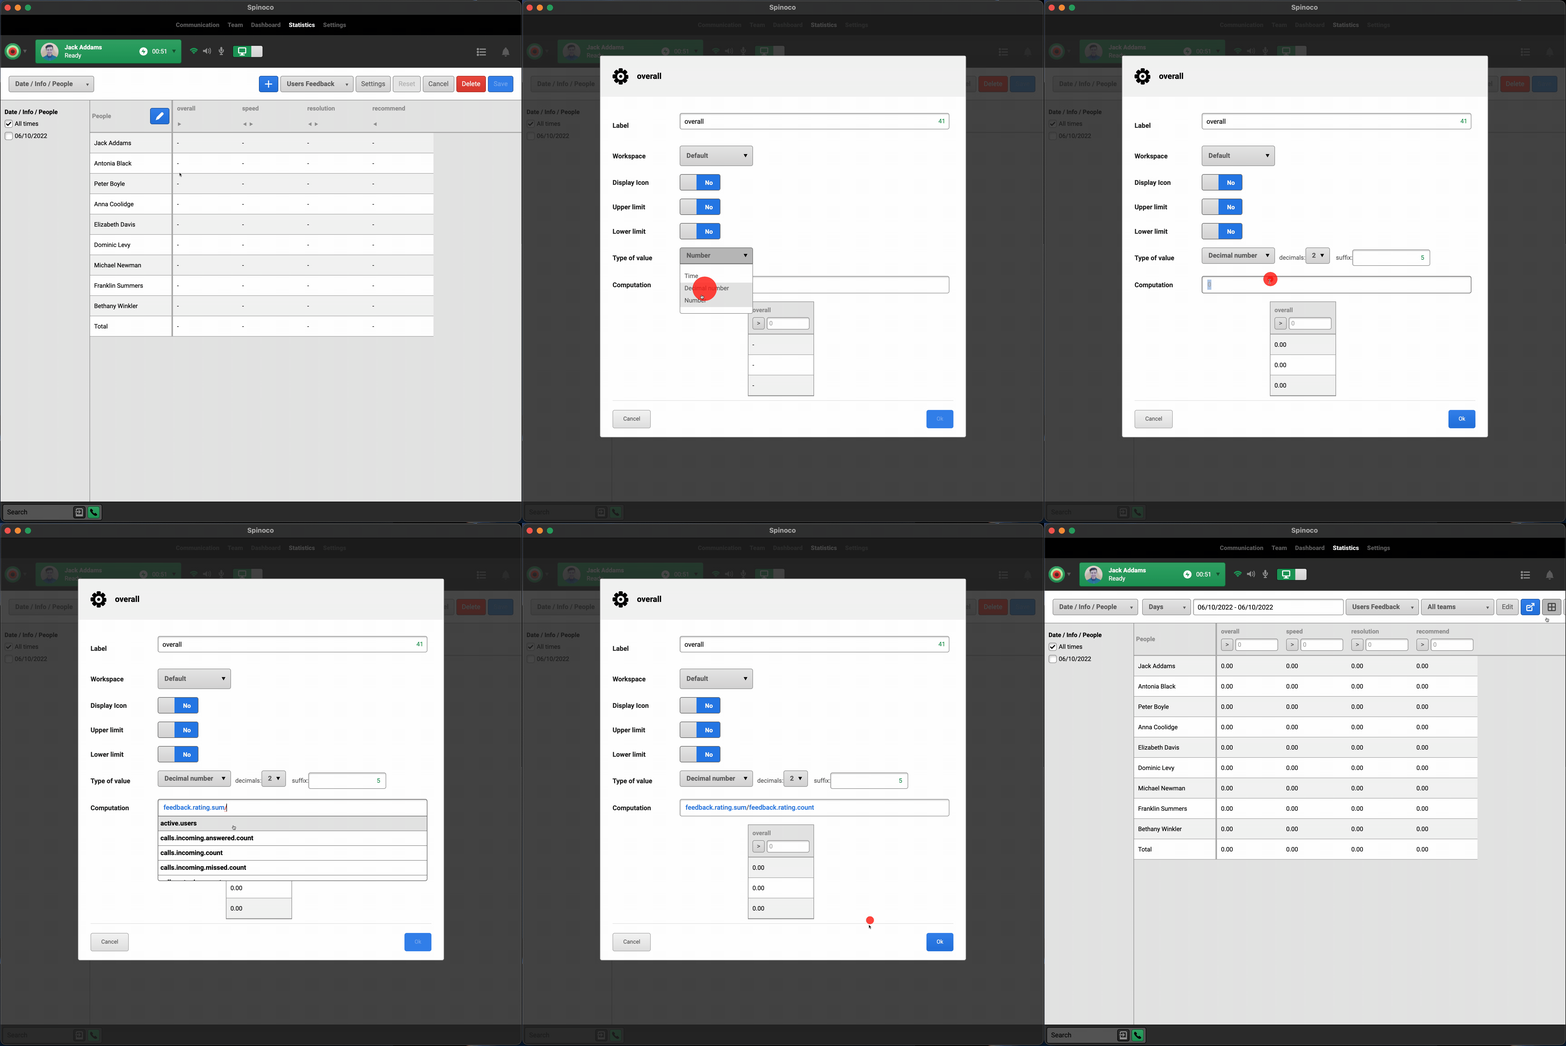
Stejným způsobem můžete vytvořit report pro jednotlivé zručnosti (například pro frontu nebo pobočku):
Pokud budete reporty potřebovat později, naleznete je v rozbalovacím seznamu reportů na záložce Statistiky.
